Background: Why Diagnostic Logging Matters
Azure Storage Accounts are a cornerstone for storing data in the cloud, offering features like scalability, durability, and security. However, managing and monitoring these resources is just as important as their setup. This is where Diagnostic Logging comes in.
Diagnostic Logging is a powerful feature that allows you to track operations, monitor errors, investigate issues, and create alerts based on activity within your storage account. Whether you’re auditing who deleted critical files, investigating firewall blocks, or monitoring transaction metrics, enabling diagnostic logging empowers you with the data you need to troubleshoot and optimize your Azure environment.
Benefits of Diagnostic Logging
Diagnostic Logging provides several crucial capabilities, including:
- Auditing Operations:
- Track who performed actions like reading, writing, or deleting files.
- Example: “Who deleted my cute kitten videos?”
- Error Monitoring:
- Identify and analyze errors, such as HTTP 404s, to resolve issues quickly.
- Example: “How many 404 errors occurred in the last hour?”
- Firewall Investigation:
- Validate connection attempts by IP addresses to troubleshoot firewall blocks.
- Example: “Was a connection from this IP address blocked?”
- Transaction Metrics:
- Monitor the number of transactions over a specific period.
- Example: “How many transactions happened yesterday?”
- Alerts and Actions:
- Set up alerts or actions based on diagnostic logs.
- Example: “Email me when new files are uploaded.”
How to Enable Diagnostic Logging in Azure Storage Accounts
Setting up diagnostic logging is straightforward. Follow these steps:
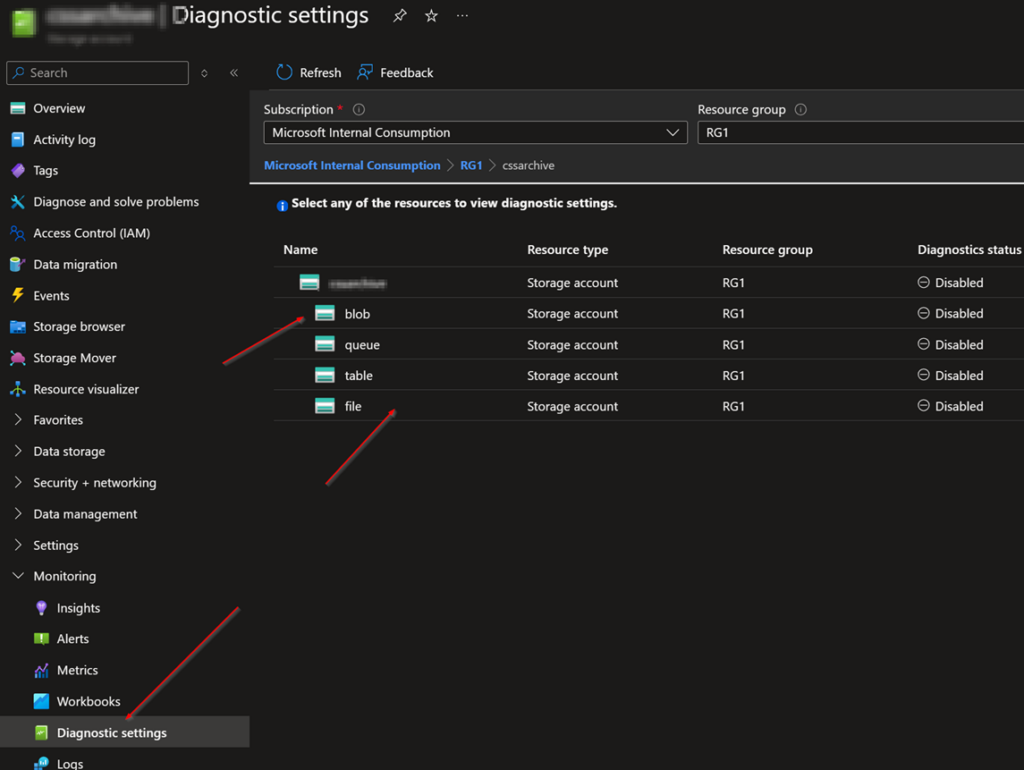
Step 1: Navigate to Diagnostic Settings
- Open the Azure Portal and go to your Storage Account.
- In the left-hand menu, select Diagnostics.
Step 2: Choose Services to Log
- Select the specific service you want to log operations for:
- File
- Blob
- Queue
- Table
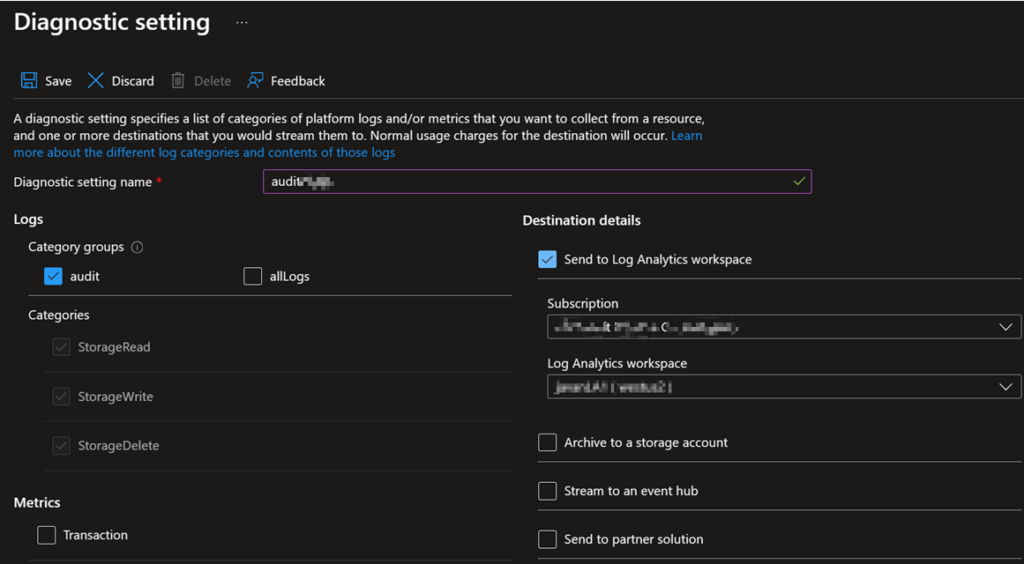
Step 3: Add a Diagnostic Setting
- Click Add a diagnostic setting.
- On the next screen:
- Name the setting: Choose any name you like (e.g., “AuditLogs”).
- Check the Audit box to log read, write, and delete operations.
Step 4: Choose Destination Details
- Select where you want the logs to go:
- The easiest option is Log Analytics Workspace.
- You can choose an existing workspace or create a new one.
- Note: Using Log Analytics comes with additional costs. Inform customers so they can disable it if they only need logging temporarily.
- Press Save to enable diagnostic logging.
How to Audit Logs
Once diagnostic logging is enabled, auditing logs is simple:
- Navigate to the Logs option in the storage account blade.
- This opens Log Analytics, where you can find diagnostic tables like:
StorageFileLogsStorageBlobLogs
- Use Kusto queries in Log Analytics to filter and analyze the logs. Keep in mind that the volume of logs can be significant depending on the activity level of the storage account.
Example Kusto Query:
StorageBlobLogs
| where OperationName == "DeleteContainer"
| summarize Count = count() by TimeGenerated
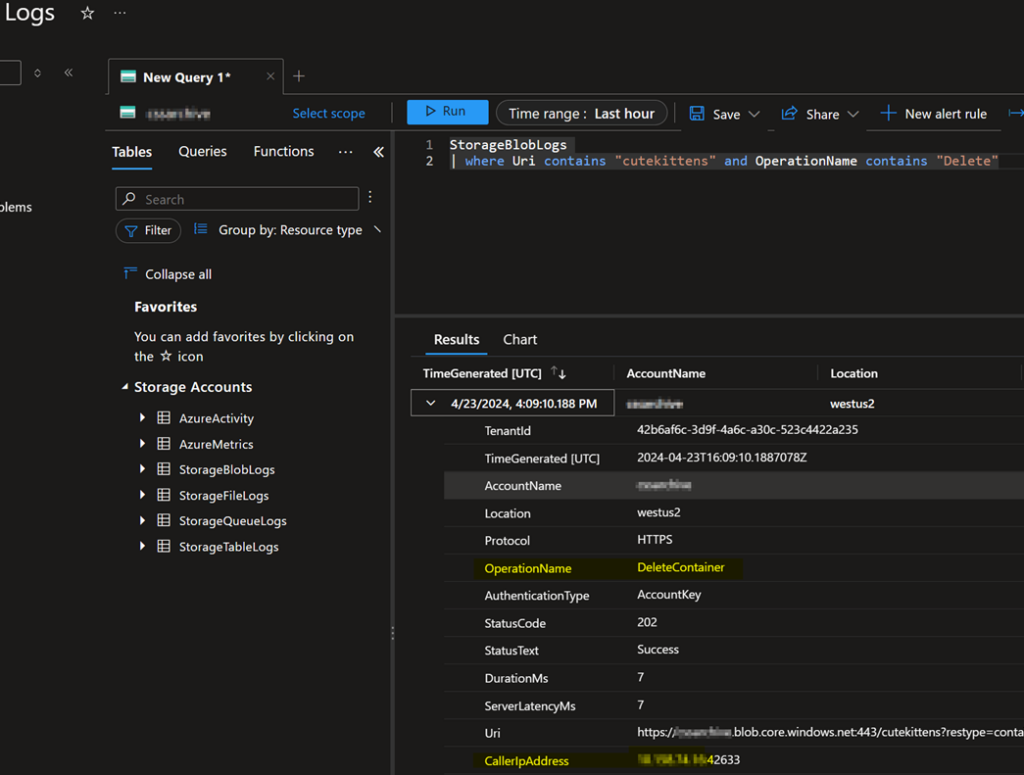
This query filters for delete operations in blob storage.
Extra Tips for Maximizing the Value of Diagnostic Logging
- Enable Diagnostic Logging Proactively: Activating diagnostic logging early ensures that organizations have the necessary data to monitor and troubleshoot their Azure Storage Account effectively. This proactive approach minimizes downtime and accelerates issue resolution by providing immediate insights into operations and errors.
- Understand Cost Implications: While Log Analytics Workspace is a powerful tool for analyzing diagnostic logs, it incurs additional costs. Organizations should evaluate their logging requirements and decide whether long-term logging or temporary activation aligns with their budget and operational goals.