
Mastering system monitoring tools for ubuntu server is essential for ensuring optimal performance, diagnosing issues, and maintaining system reliability. In this tutorial, we’ll explore the best system monitoring tools available for Ubuntu servers, including real-time resource monitoring, disk I/O, network activity, and server dashboards.
Previous Article:
01. Introduction to Ubuntu Server – SysOSX: AI & Cloud
02. How to Setup Your First Ubuntu Server: A Beginner’s Guide – SysOSX: AI & Cloud
03.Mastering the Linux Command Line for Ubuntu Server – SysOSX: AI & Cloud
04. Managing Users and Permissions on Ubuntu Server: A Comprehensive Guide – SysOSX: AI & Cloud
05. Networking Basics for Ubuntu Server: A Comprehensive Guide – SysOSX: AI & Cloud
06. Installing and Managing Software on Ubuntu Server: A Complete Guide – SysOSX: AI & Cloud
07.Patching and Updating Ubuntu Server: A Comprehensive Guide – SysOSX: AI & Cloud
08. Securing Your Ubuntu Server: Practical Steps for Hardening and Protection – SysOSX: AI & Cloud
09. Ubuntu server auditing and logging
Table of Contents
- Using htop and top for Real-Time Resource Monitoring
- Installing and Configuring sysstat for Performance Metrics
- Monitoring Disk I/O and Network Activity
- Setting Up Server Dashboards with Cockpit
- Other Recommended Monitoring Tools
- Conclusion
Using htop and top for Real-Time Resource Monitoring
Introduction to htop and top
Both htop and top are essential command-line tools for monitoring system resources in real time. They display information such as CPU usage, memory consumption, and running processes.
Installing and Running htop (it’s installed by default)
To install htop, run:
sudo apt update
sudo apt install htop
To launch htop, simply type:
htop
Key Features and Use Scenarios for htop
htop is ideal for:
- Identifying Resource-Intensive Processes: You can sort processes by CPU or memory usage to quickly find resource hogs.
- Killing Processes: Use
F9to terminate unresponsive or problematic processes directly from thehtopinterface. - Monitoring Threads: Expand processes to view individual threads and their resource usage.
- Customizing Columns: Press
F2to configure the display and add/remove metrics like disk I/O or network utilization.

Using top
top is a simpler tool, pre-installed on Ubuntu servers. To run it:
top
Key commands for top:
- Press
Shift + pto sort by CPU usage. - Press
Shift + mto sort by memory usage. - Press
qto quit.

Installing and Configuring sysstat for Performance Metrics
What is sysstat?
sysstat is a suite of tools for collecting and reporting system performance metrics over time. It includes utilities like iostat, vmstat, and sar.
Installing sysstat
To install sysstat:
sudo apt update
sudo apt install sysstat
Configuring sysstat
Enable data collection by editing the configuration file:
sudo nano /etc/default/sysstat
Change ENABLED="false" to ENABLED="true". Save and exit, then restart the service:
sudo systemctl restart sysstat
Using sysstat Tools
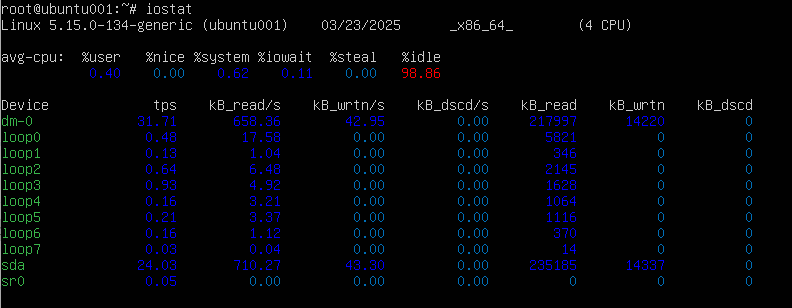
iostat: Monitor disk I/O performance.iostat
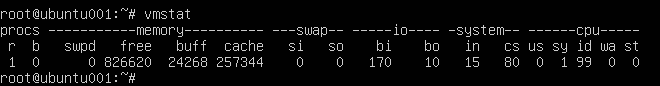
vmstat: Monitor memory, CPU, and I/O statistics.vmstat
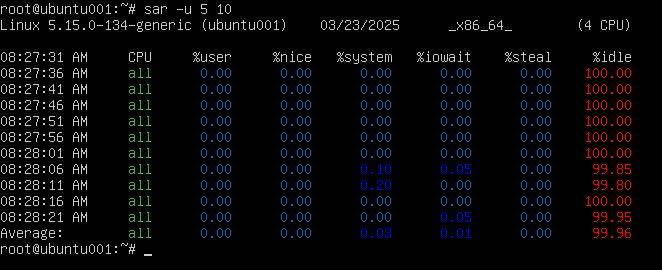
sar: Generate historical reports of system activity.sar -u 5 10 # CPU usage every 5 seconds for 10 intervals
Monitoring Disk I/O and Network Activity
Disk I/O Monitoring with iotop
Use tools like iostat (from sysstat) or iotop for real-time disk I/O monitoring.
To install iotop:
sudo apt update
sudo apt install iotop
Run iotop with:
sudo iotop
However, some users may encounter the following error when running iotop:
CONFIG_TASK_DELAY_ACCT not enabled in kernel, cannot determine SWAPIN and IO %
Fixing the iotop Error
This issue occurs because the kernel is missing the CONFIG_TASK_DELAY_ACCT feature, which is required for iotop to display SWAPIN and IO percentages. Fortunately, this can be resolved by updating the GRUB configuration.
Steps to Fix the Error
- Edit the GRUB configuration file:
sudo nano /etc/default/grub
- Add the
delayacctoption to theGRUB_CMDLINE_LINUX_DEFAULTentry. If the line is initially empty (GRUB_CMDLINE_LINUX_DEFAULT=""), update it as follows:GRUB_CMDLINE_LINUX_DEFAULT="delayacct"If the line already contains other options, appenddelayacctto the existing options, separated by a space. For example:
GRUB_CMDLINE_LINUX_DEFAULT="quiet splash delayacct"
- Update GRUB to apply the changes:
sudo update-grub
- Reboot the server:
sudo reboot
After the reboot, the error should be resolved, and iotop will function correctly.
Using `iotop
Once the issue is fixed, you can run iotop to monitor disk I/O:
sudo iotop
What You Can Do with iotop
- Identify processes causing high disk I/O.
- Monitor read/write operations in real time.
- Sort processes by disk usage.

Network Activity Monitoring
Using iftop
To install iftop:
sudo apt update
sudo apt install iftop
Run iftop with:
sudo iftop

Using nload
To install nload:
sudo apt update
sudo apt install nload
Run nload with:
nload

Setting Up Server Dashboards with Cockpit
What is Cockpit?
Cockpit is a web-based graphical dashboard for monitoring and managing servers. It provides real-time insights into CPU, memory, disk usage, and network activity.
Installing Cockpit
To install Cockpit:
sudo apt update
sudo apt install cockpit
Accessing Cockpit
Start the Cockpit service:
sudo systemctl start cockpit.socket
sudo systemctl enable cockpit.socket
Access the dashboard by navigating to:
https://<your-server-ip>:9090
Features of Cockpit
- Monitor system performance visually.
- Manage services, logs, and user accounts.
- View disk usage and network activity.


Other Recommended Monitoring Tools
While tools like htop, sysstat, and Cockpit are excellent for most server monitoring needs, there are other advanced tools that can provide deeper insights and better visualization for complex environments. Below are some additional monitoring tools that you can consider:
Prometheus and Grafana
Prometheus
Prometheus is an open-source monitoring and alerting toolkit designed for reliability and scalability. It is widely used in cloud-native environments and is particularly well-suited for monitoring distributed systems and microservices.
Key Features:
- Time-series database: Stores metrics efficiently with timestamps.
- Powerful query language (
PromQL) for analyzing metrics. - Alerting system: Integrated with tools like Alertmanager for notifications.
- Pull-based architecture: Prometheus actively scrapes metrics from targets.
Use Cases:
- Monitor CPU, memory, and disk usage across multiple servers.
- Track application-specific metrics (e.g., HTTP request latency, error rates).
- Generate alerts for unusual metrics or system failures.
Installation Instructions:
To install Prometheus on Ubuntu:
sudo apt update
wget https://github.com/prometheus/prometheus/releases/download/v2.44.0/prometheus-2.44.0.linux-amd64.tar.gz
tar xvf prometheus-2.44.0.linux-amd64.tar.gz
cd prometheus-2.44.0.linux-amd64
./prometheus
Access Prometheus by navigating to:
http://<your-server-ip>:9090

Please be aware that both Prometheus and Cockpit both default port is 9090, you might want to change the default port if you are using them at the same time:
Resolving Port Conflict Between Prometheus and Cockpit
Option 1: Change Prometheus Port
You can configure Prometheus to use a different port by modifying its configuration file.
- Open the Prometheus configuration file:
nano prometheus.yml
- Add or modify the
--web.listen-addressflag in the Prometheus startup command or service file to specify a different port (e.g.,9091):
--web.listen-address=:9091
- Restart Prometheus to apply the changes:
sudo systemctl restart prometheus
- Access Prometheus using the new port:
http://<your-server-ip>:9091
Option 2: Change Cockpit Port
Cockpit’s default port can also be changed if you prefer to keep Prometheus on port 9090.
- Create a custom configuration file for Cockpit:
sudo nano /lib/systemd/system/cockpit.socket
- Add the following lines to specify a new port (e.g.,
9092):ListenStream=9092 - Restart the Cockpit service:
systemctl daemon-reload
systemctl restart cockpit.socket
- Access Cockpit using the new port:
https://<your-server-ip>:9092
Option 3: Use a Reverse Proxy
If changing ports is not ideal, you can use a reverse proxy (e.g., Nginx or Apache) to map both services to different URLs while keeping them on their default ports.
For example:
- Prometheus:
http://<your-server-ip>/prometheus
- Cockpit:
http://<your-server-ip>/cockpit
Recommendation
If you’re using both tools frequently:
Document the port changes for future reference or for other administrators.
Change Prometheus to port 9091 since Cockpit is more commonly accessed via its default port 9090.
Grafana
Grafana is a powerful visualization platform that integrates seamlessly with Prometheus. It allows you to create dynamic dashboards to visualize metrics and trends.
Key Features:
- Multi-source support: Works with Prometheus, Elasticsearch, MySQL, and more.
- Custom dashboards: Create interactive graphs, heatmaps, and tables.
- Alerting: Set up alerts based on thresholds for key metrics.
- Sharing: Easily share dashboards with teams.
Use Cases:
- Visualize server performance metrics collected by Prometheus.
- Monitor trends over time for better capacity planning.
- Display data from multiple sources in a unified dashboard.
Installation Instructions:
To install Grafana on Ubuntu:
sudo apt update
sudo apt install -y software-properties-common
sudo wget -q -O - https://packages.grafana.com/gpg.key | gpg --dearmor | sudo tee /usr/share/keyrings/grafana.gpg > /dev/null
sudo echo "deb [signed-by=/usr/share/keyrings/grafana.gpg] https://packages.grafana.com/oss/deb stable main" | sudo tee -a /etc/apt/sources.list.d/grafana.list
sudo apt update
sudo apt install grafana
sudo systemctl start grafana-server
sudo systemctl enable grafana-server
sudo systemctl status grafana-server
Access Grafana by navigating to:
http://<your-server-ip>:3000

Nagios
Nagios is one of the most popular infrastructure monitoring tools. It provides comprehensive monitoring and alerting for servers, network devices, and applications. It is highly customizable and supports plugins for extended functionality.
Key Features:
- Monitor server health: Track CPU, memory, disk usage, and more.
- Network monitoring: Detect issues with routers, switches, and firewalls.
- Alerting: Send notifications via email, SMS, or integrations with Slack.
- Extensive plugin library: Monitor databases, web servers, and other services.
Use Cases:
- Monitor critical servers and applications in production environments.
- Receive alerts for disk space running low or high CPU utilization.
- Monitor uptime and availability of network devices.
Installation Instructions:
To install Nagios on Ubuntu:
sudo apt install nagios4 nagios-plugins
sudo a2enmod rewrite cgi
systemctl restart apache2
sudo systemctl status nagios4
sudo systemctl enable nagios4
sudo systemctl start nagios4
Nagios requires additional configuration to set up monitoring targets. For detailed configuration, refer to the Nagios documentation.

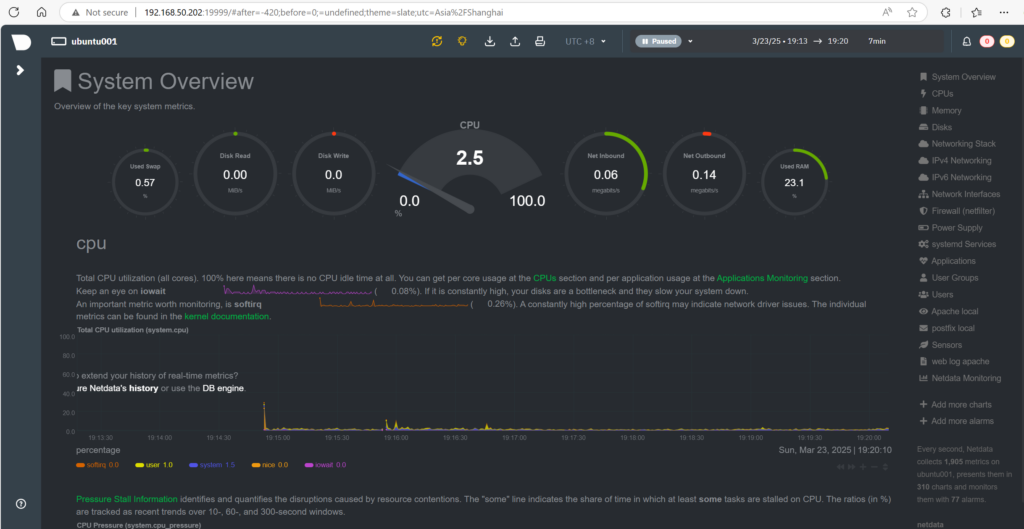
Netdata: Real-Time System Monitoring Tool
Netdata is a lightweight, real-time monitoring tool that provides detailed insights into system performance. It is easy to install and comes with a beautiful web interface for visualizing metrics.
Step 1: Update System Packages
Ensure your system is up-to-date by running the following commands in the terminal:
sudo apt update
sudo apt upgrade
Step 2: Install Netdata
Install Netdata from the default Ubuntu repository:
sudo apt install netdata
Step 3: Configure Netdata
Edit the Netdata configuration file to allow remote access:
sudo nano /etc/netdata/netdata.conf
Locate the bind socket to IP field and replace 127.0.0.1 with your server’s IP address:
[global]
bind socket to IP = <your-server-ip>
Save the file and restart the Netdata service:
sudo systemctl restart netdata
Step 4: Configure Firewall
Allow access to Netdata’s default port (19999) and enable the firewall:
sudo ufw allow 19999
sudo ufw allow OpenSSH
sudo ufw enable
sudo ufw status
Step 5: Access Netdata Web Interface
Open your web browser and navigate to:
http://<your-server-ip>:19999
Comparison of Tools
| Tool | Best For | Ease of Use | Visualization | Alerting |
|---|---|---|---|---|
| Prometheus | Large-scale metric collection | Moderate | Limited | Yes |
| Grafana | Advanced dashboards | Easy | Excellent | Yes |
| Nagios | Infrastructure monitoring | Moderate | Basic | Yes |
| Netdata | Lightweight real-time monitoring | Easy | Excellent | Yes |
Conclusion
Monitoring your Ubuntu server is critical for maintaining performance, diagnosing issues, and preventing downtime. Tools like htop, top, sysstat, Cockpit, and others provide administrators with the ability to monitor resources effectively. Whether you prefer command-line tools or graphical dashboards, this guide covers everything you need to set up a robust monitoring system.
Up Next: Centralized Logging and Monitoring
In the next article, we’ll focus on centralized logging and monitoring to further streamline server management and performance tracking. Topics will include:
- Setting up rsyslog or syslog-ng for centralized logging.
- Forwarding logs to a remote logging server for better organization and analysis.
- Integrating your Ubuntu server with robust monitoring platforms like Nagios, Zabbix, or Prometheus to gain deeper insights into system health and performance.
Stay tuned to learn how to centralize your logging infrastructure and leverage monitoring tools to optimize server operations effectively!
2 thoughts on “10. System Monitoring Tools for Ubuntu Server: A Comprehensive Guide”